
Forex Trendline Trading
Plotting a trend line on a Forex chart gives you a very valuable information.
Not only the trend line will show a current trend (direction) of the price move, it will also illustrate points of support and resistance levels for market price.
In addition, it will also help to determine good entry and exit points, best positioning for profit taking and placing protective stops.
This very simple, but yet quite powerful tool will be one of the crucial indicators of possible trend reversal.
(when market price starts move in the opposite direction).
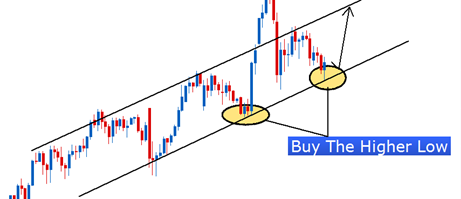
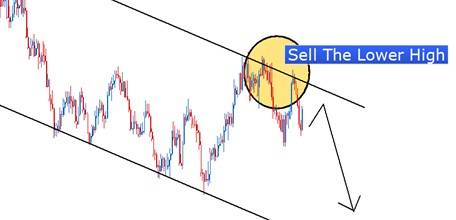
In the uptrend market the trend line is drawn below the pattern formation; in the downtrend above, that is why when the trend is going to change our trend line will be crossed, which therefore will give us a signal that the price can start moving in another direction.

In the uptrend, the trend line is drawn through the lowest swing-points of the price move.
Connecting at least two "lowest lows" will create a trend line.
In the down trend, trend line is drawn through the highest swing-points of the price move.
Connecting at least two "highest highs" will create a trend line.
Keep in mind that the same charts may show slightly different "highs" and "lows" if you try to compare different brokers. The reason is that the Forex quotes often vary from broker to broker (it is a small difference and is often clearly noticeable when it comes to drawing trend lines).

Risk Disclosure: FX Trading Online will not accept any liability for loss or damage as a result of reliance on the information contained within this website. Please be fully informed regarding the risks and costs associated with trading the financial markets. Currency trading on margin involves high risk and is not suitable for all investors. Before deciding to trade foreign exchange or any other financial instrument you should carefully consider your investment objectives, level of experience, and risk appetite.